A dashing redesign
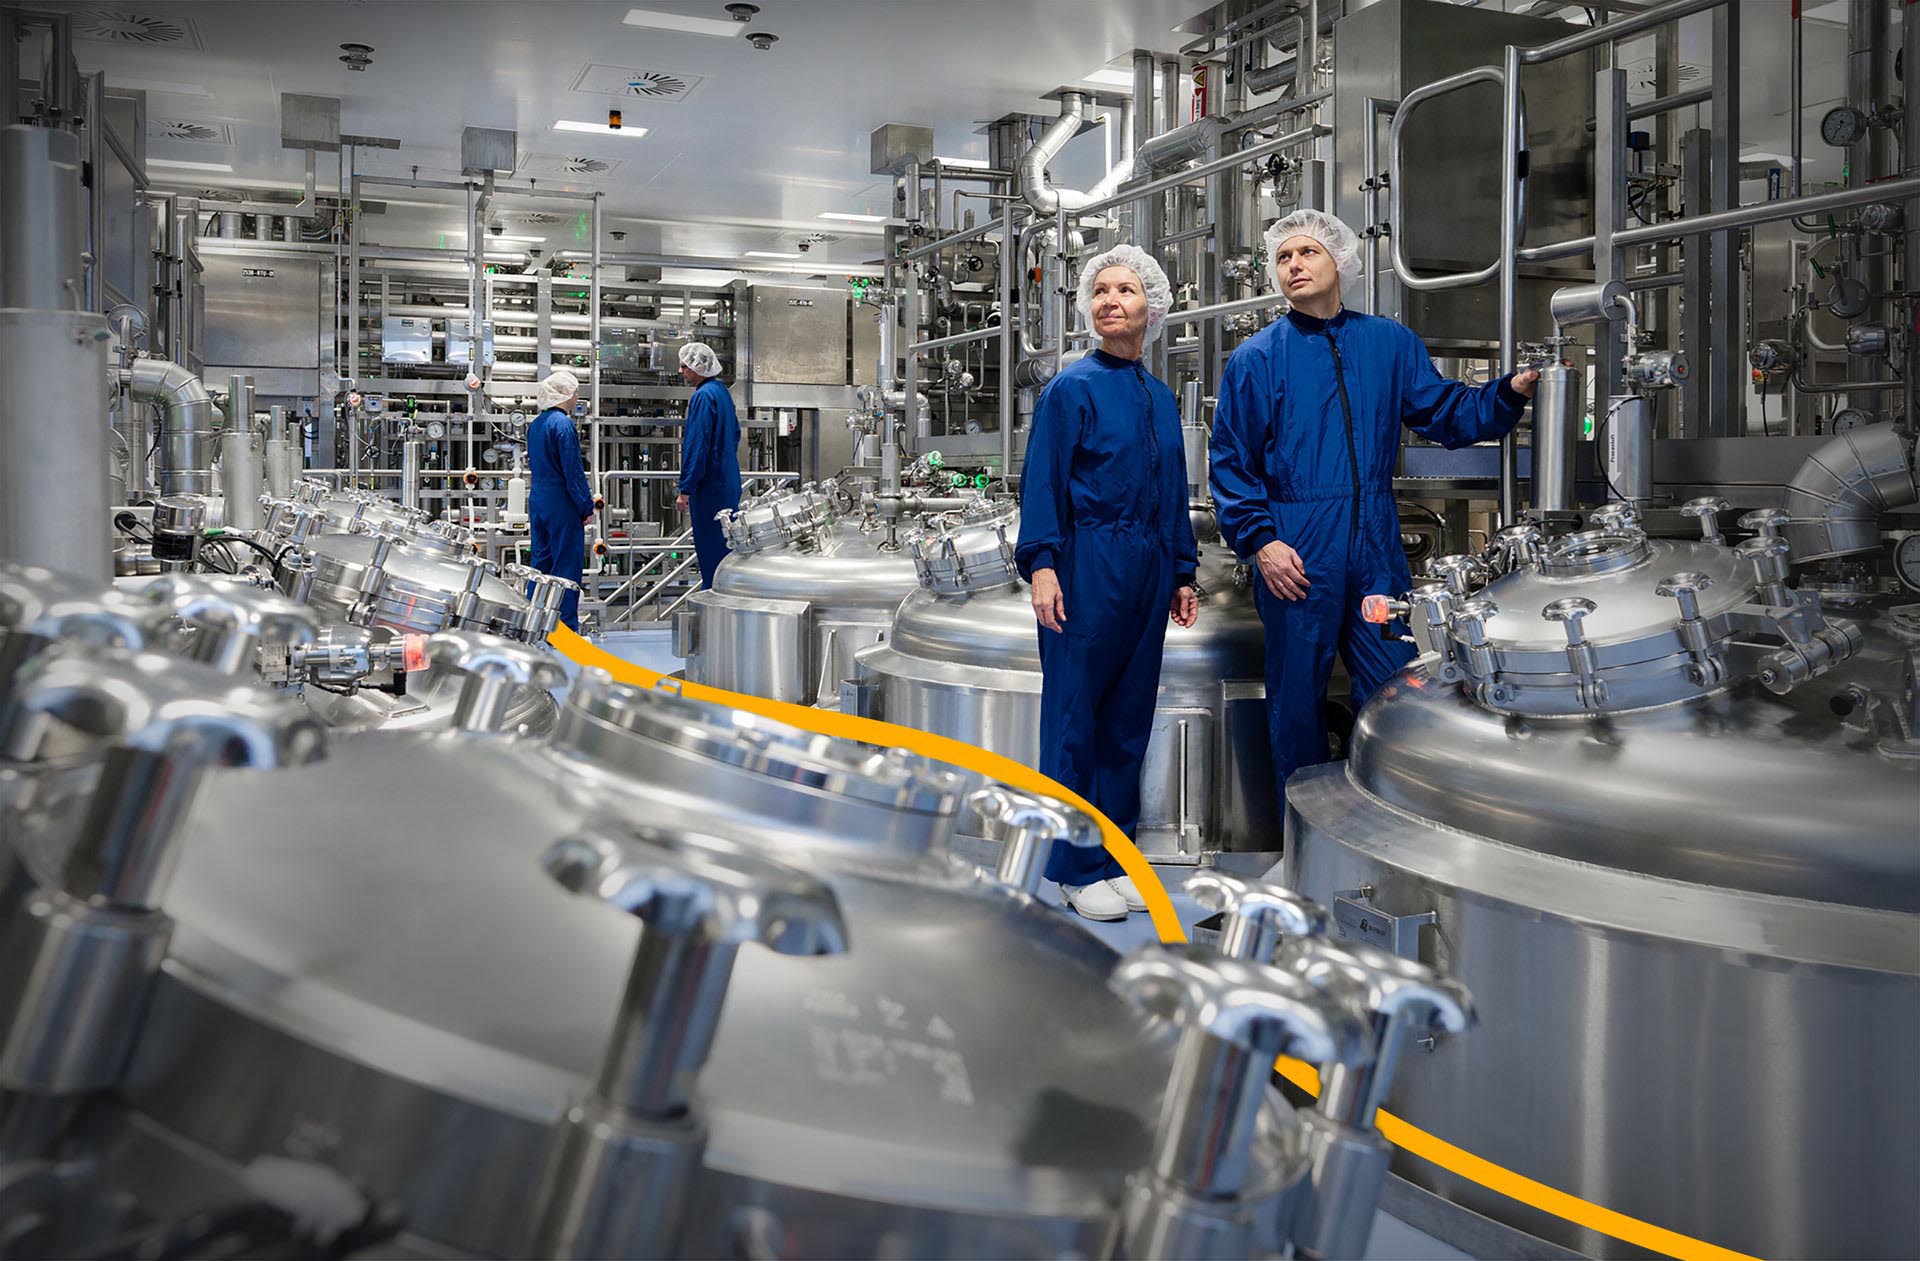
In my role as a Product Designer, I was tasked with applying design thinking methodology to ensure
that the digital transformation of their desktop data visualization tool prioritized user-centric
design. This involved addressing a wide range of aspects, including real-time manufacturing
statistics and temperature monitoring.
The dashboard solution found daily use among both factory workers and factory managers.
 NN factory workers
They accessed it via
stationary, large desktop monitors placed at various factory locations. Several key features were
necessary for the dashboard:
NN factory workers
They accessed it via
stationary, large desktop monitors placed at various factory locations. Several key features were
necessary for the dashboard:
1. Customization: Users had the ability to tailor their own dashboards, allowing them to switch
between
chart, graph, or table displays as needed.
2. Real-time Updates: The dashboard ensured real-time or near-real-time data updates,
guaranteeing users
access to the most up-to-date information.
3. Interactive Data Visualizations: The dashboard provided engaging and informative data visuals.
4. Alerts and Notifications: Users received alerts and notifications as part of the dashboard's
functionality.
Project Brief
The existing design suffers from disorganization, appears cluttered, and lacks a coherent color scheme.
The redesign effort should concentrate on simplifying the interface, improving user-friendliness, and
mirroring the state-of-the-art technology that drives the factory.
Additionally, it should integrate design elements that are user-friendly and readily adaptable to
different data types.
Picking brains and taking names
In the research phase, I conducted a series of interviews with around 20 factory workers and other stakeholders who routinely engaged with the dashboard interface. My primary objective was to pinpoint specific areas in need of improvement.
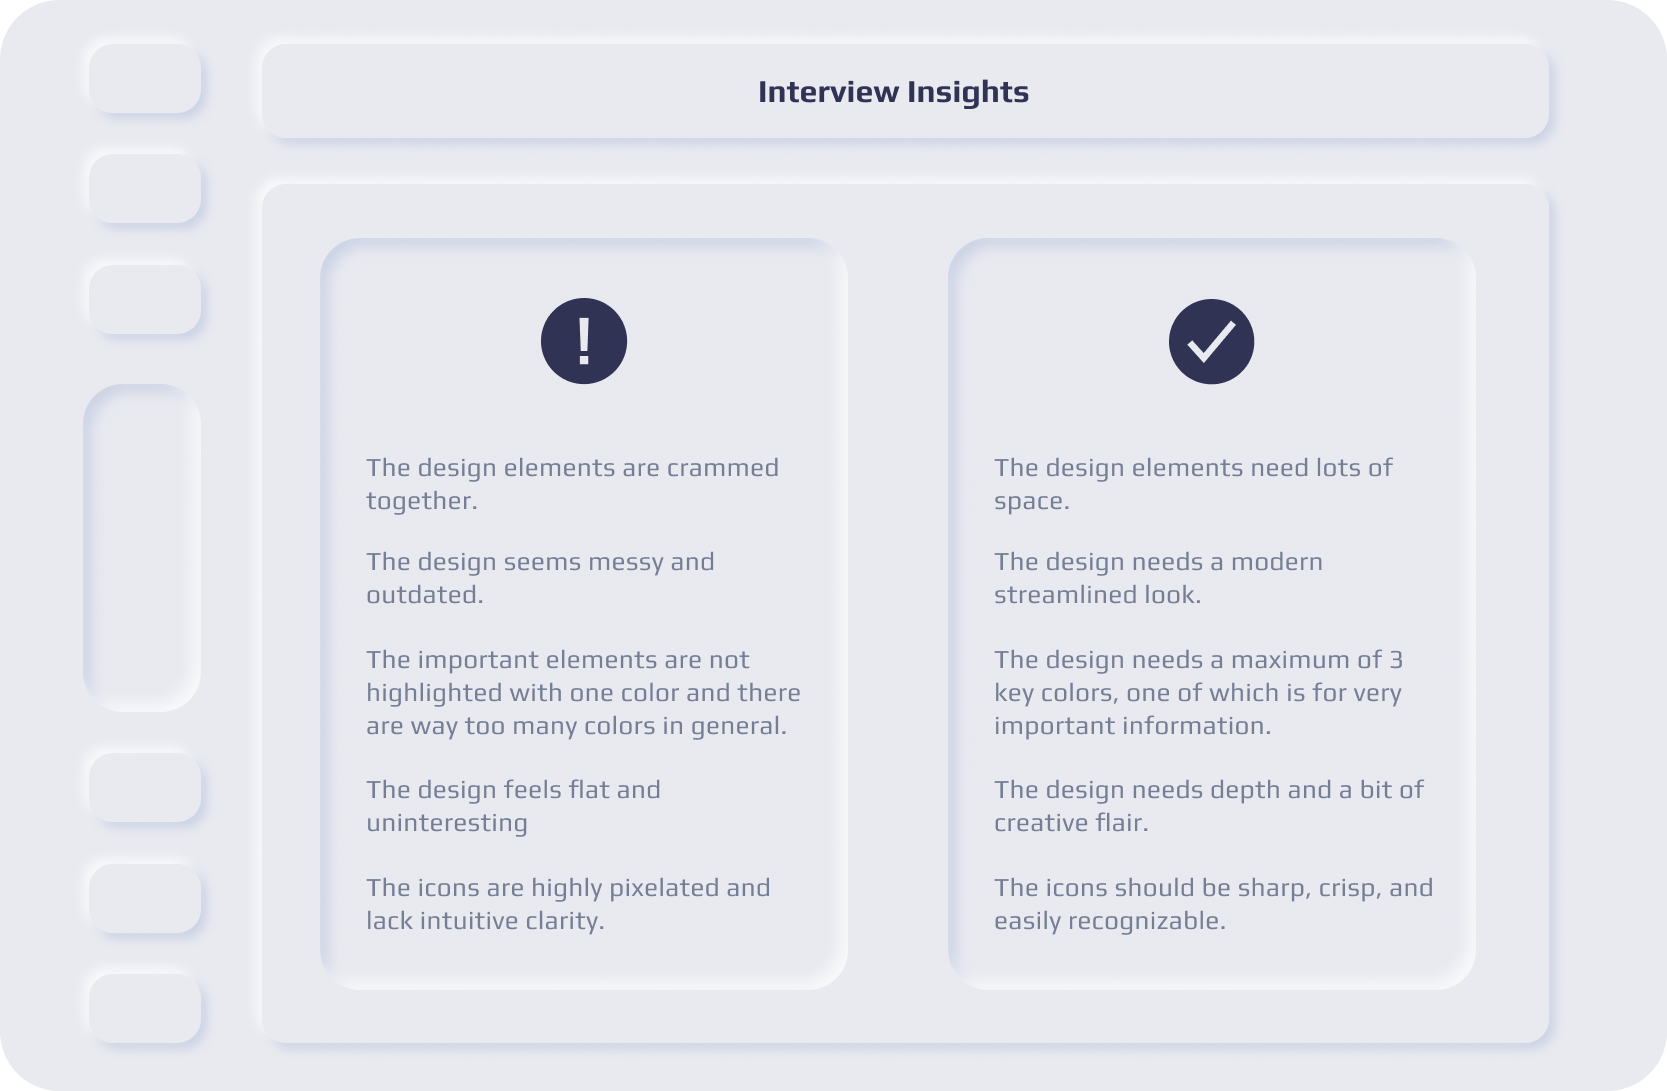 Top 5 interview findings
After carefully noting their feedback and actively listening to their input, I distilled their comments into five major pain points, each of which had been mentioned by three or more individuals.
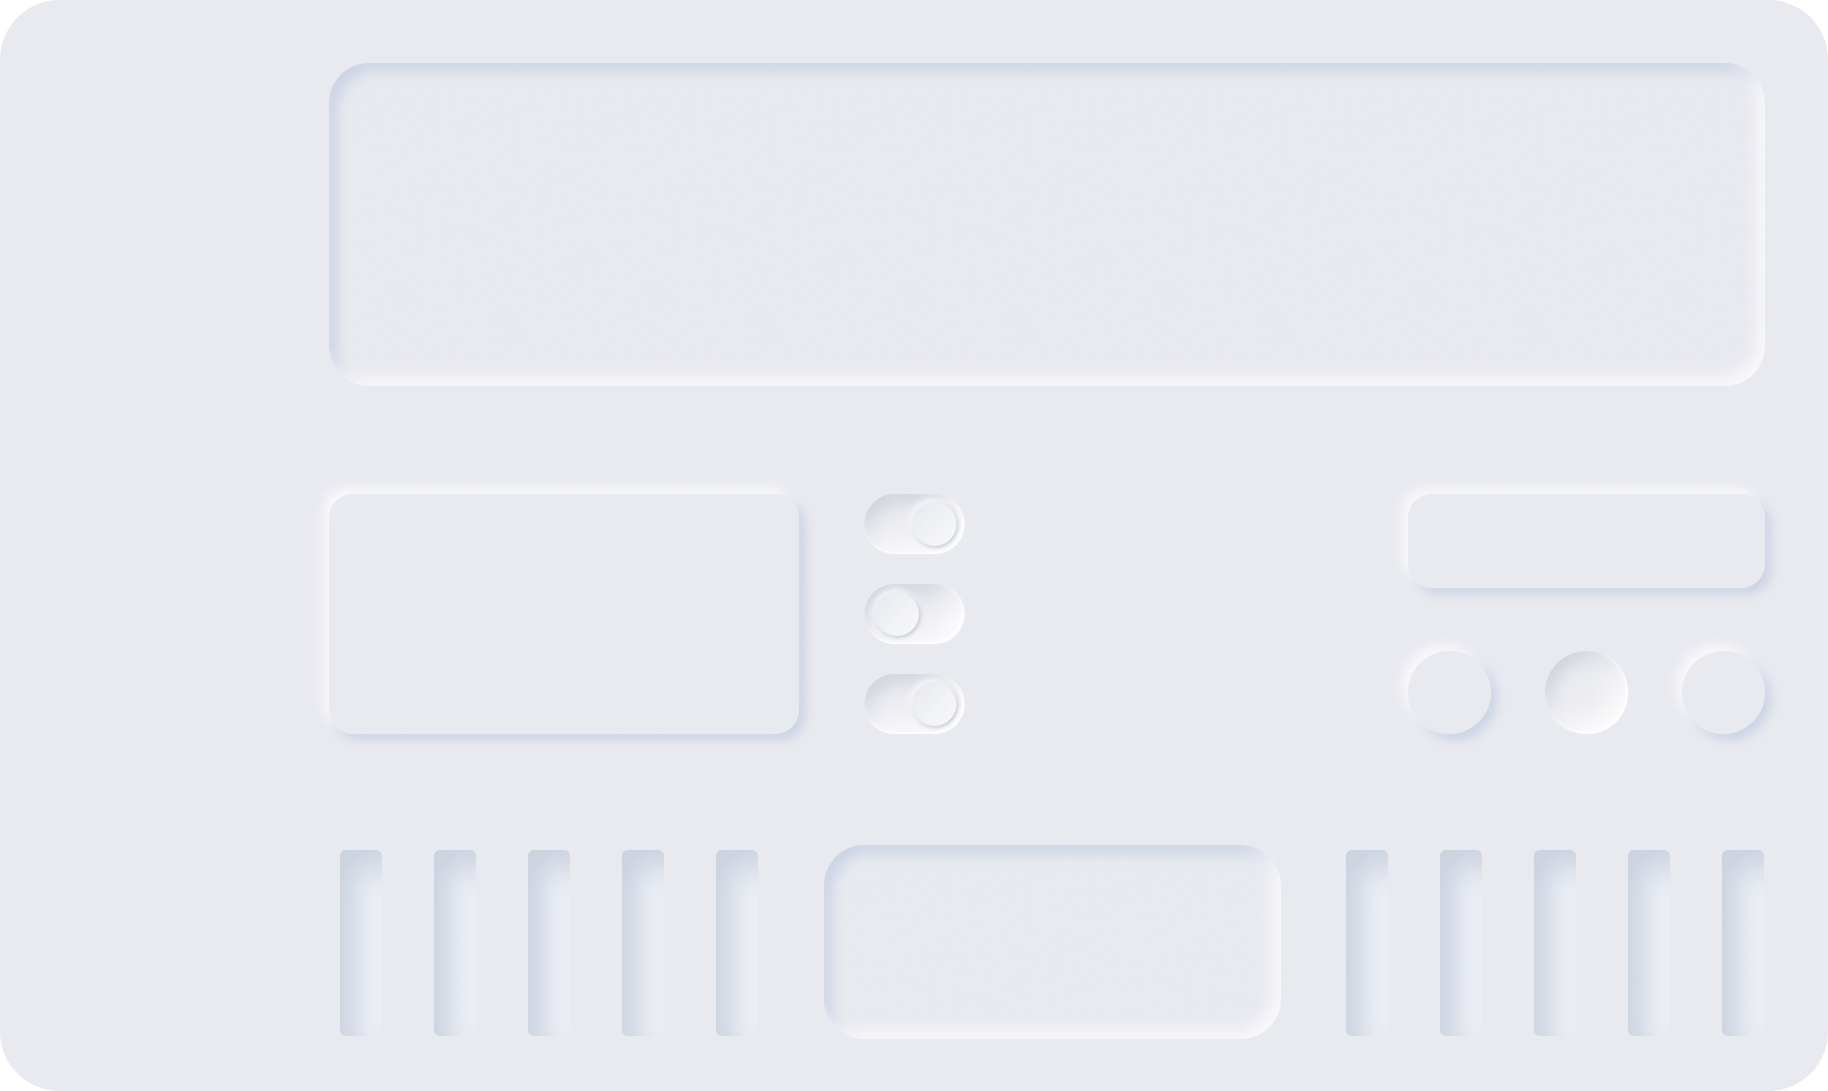
Simplified complexity
During the ideation phase, I quickly zeroed in on a visual style intended to alleviate the pain points experienced by many users. This approach involved implementing a design characterized by spaciousness, a clean and streamlined look that prevents clutter, futuristic and an exploration of various levels of depth.
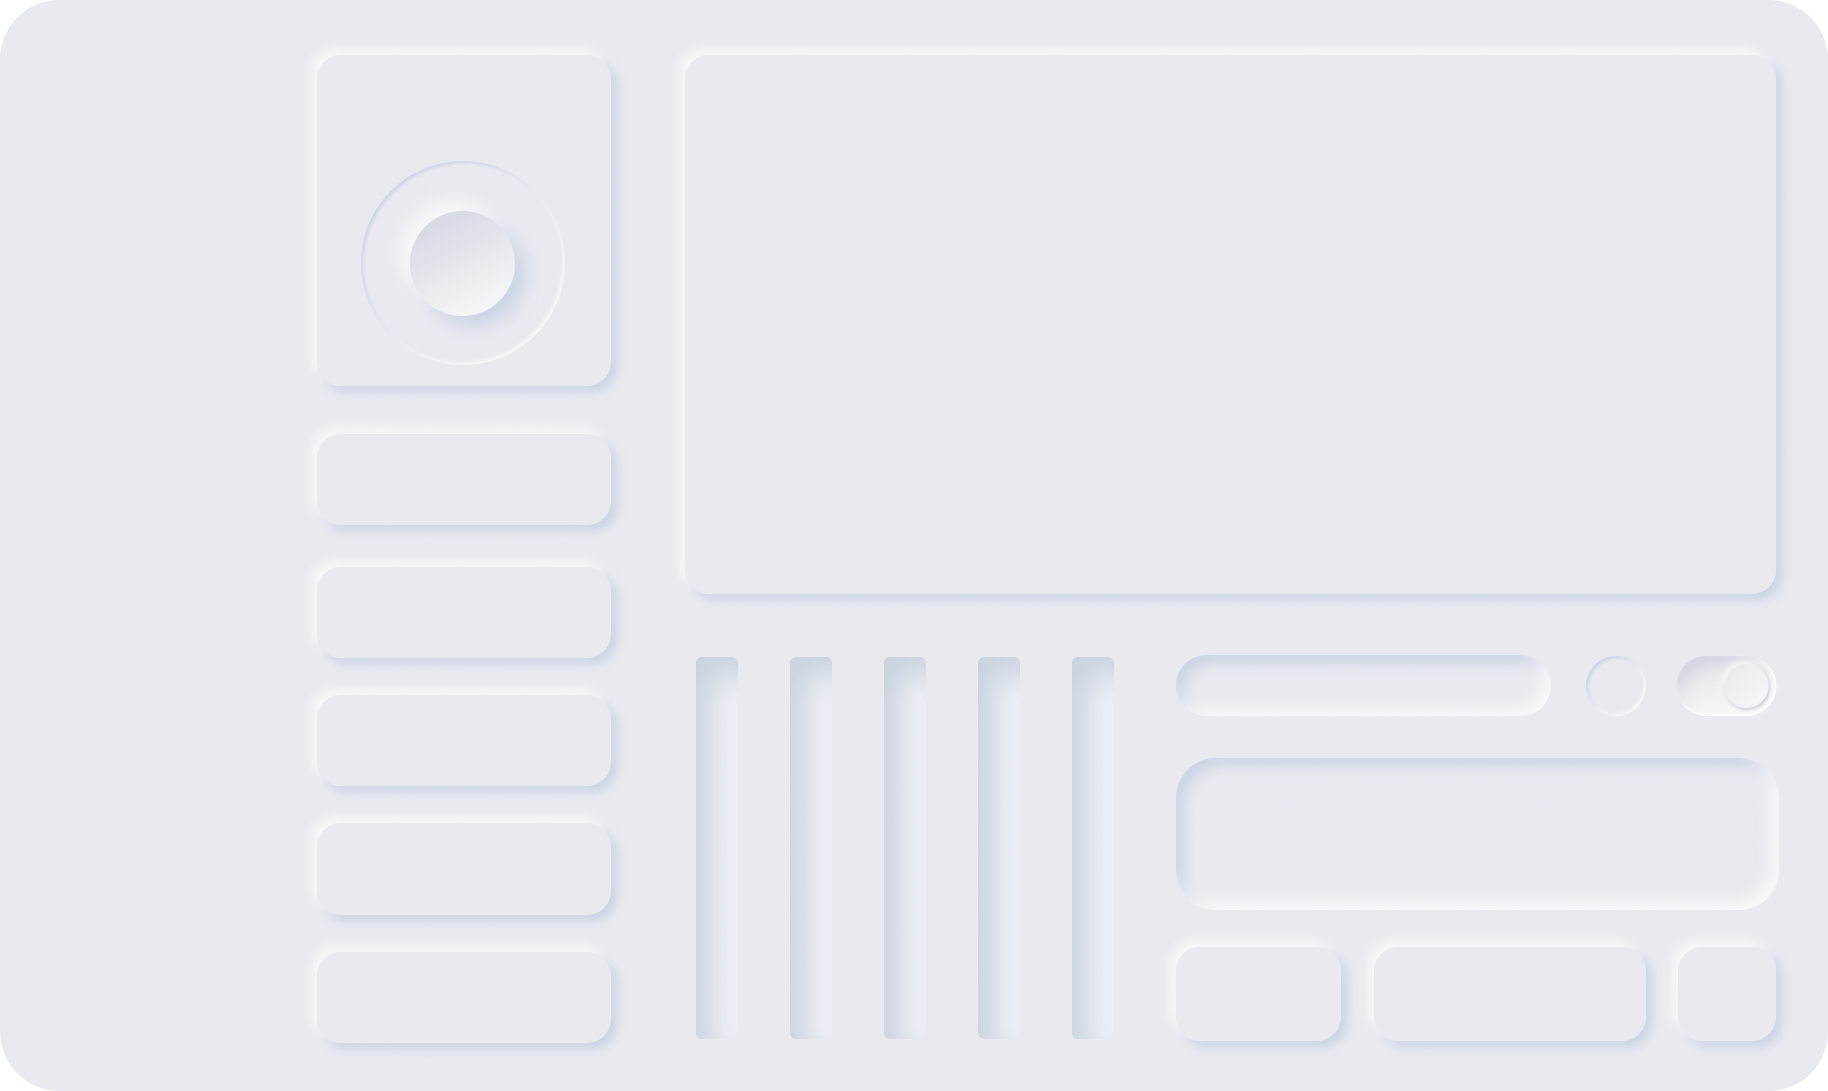
The remarkable aspect of being a product designer is the ability to take something exceedingly complex and present it in a simple way. When I introduced this general design concept to some of the interviewees, they became quite enthusiastic. They described it as streamlined, efficient, and refreshingly simple.
Colours, icons and typography
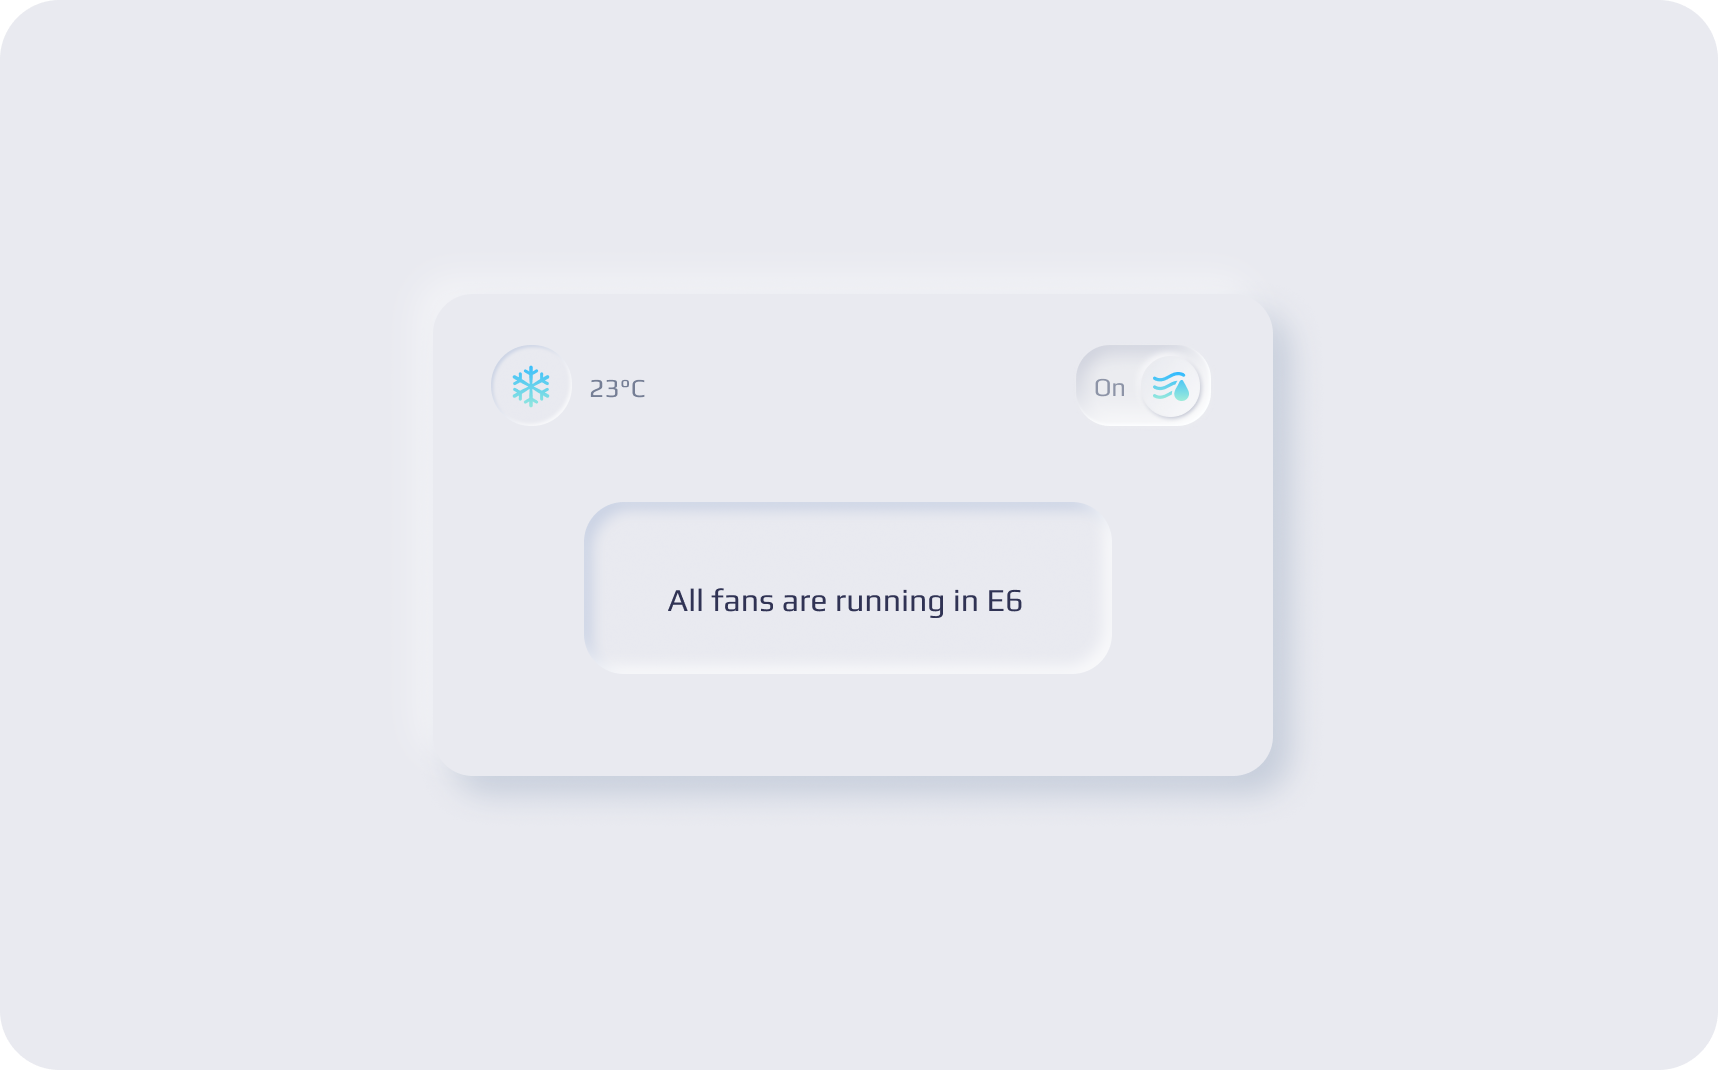
With the foundation in place, it was time to introduce the graphical elements that would bring the dashboard to life. Starting with the basics, colors were the initial consideration. One of Novo Nordisk's primary colours are dark blue, making it a natural choice as one of the key colours. To represent cold temperatures, I opted for a light blue gradient. This choice complemented the overall design, adding depth and imbuing it with a modern sensibility.
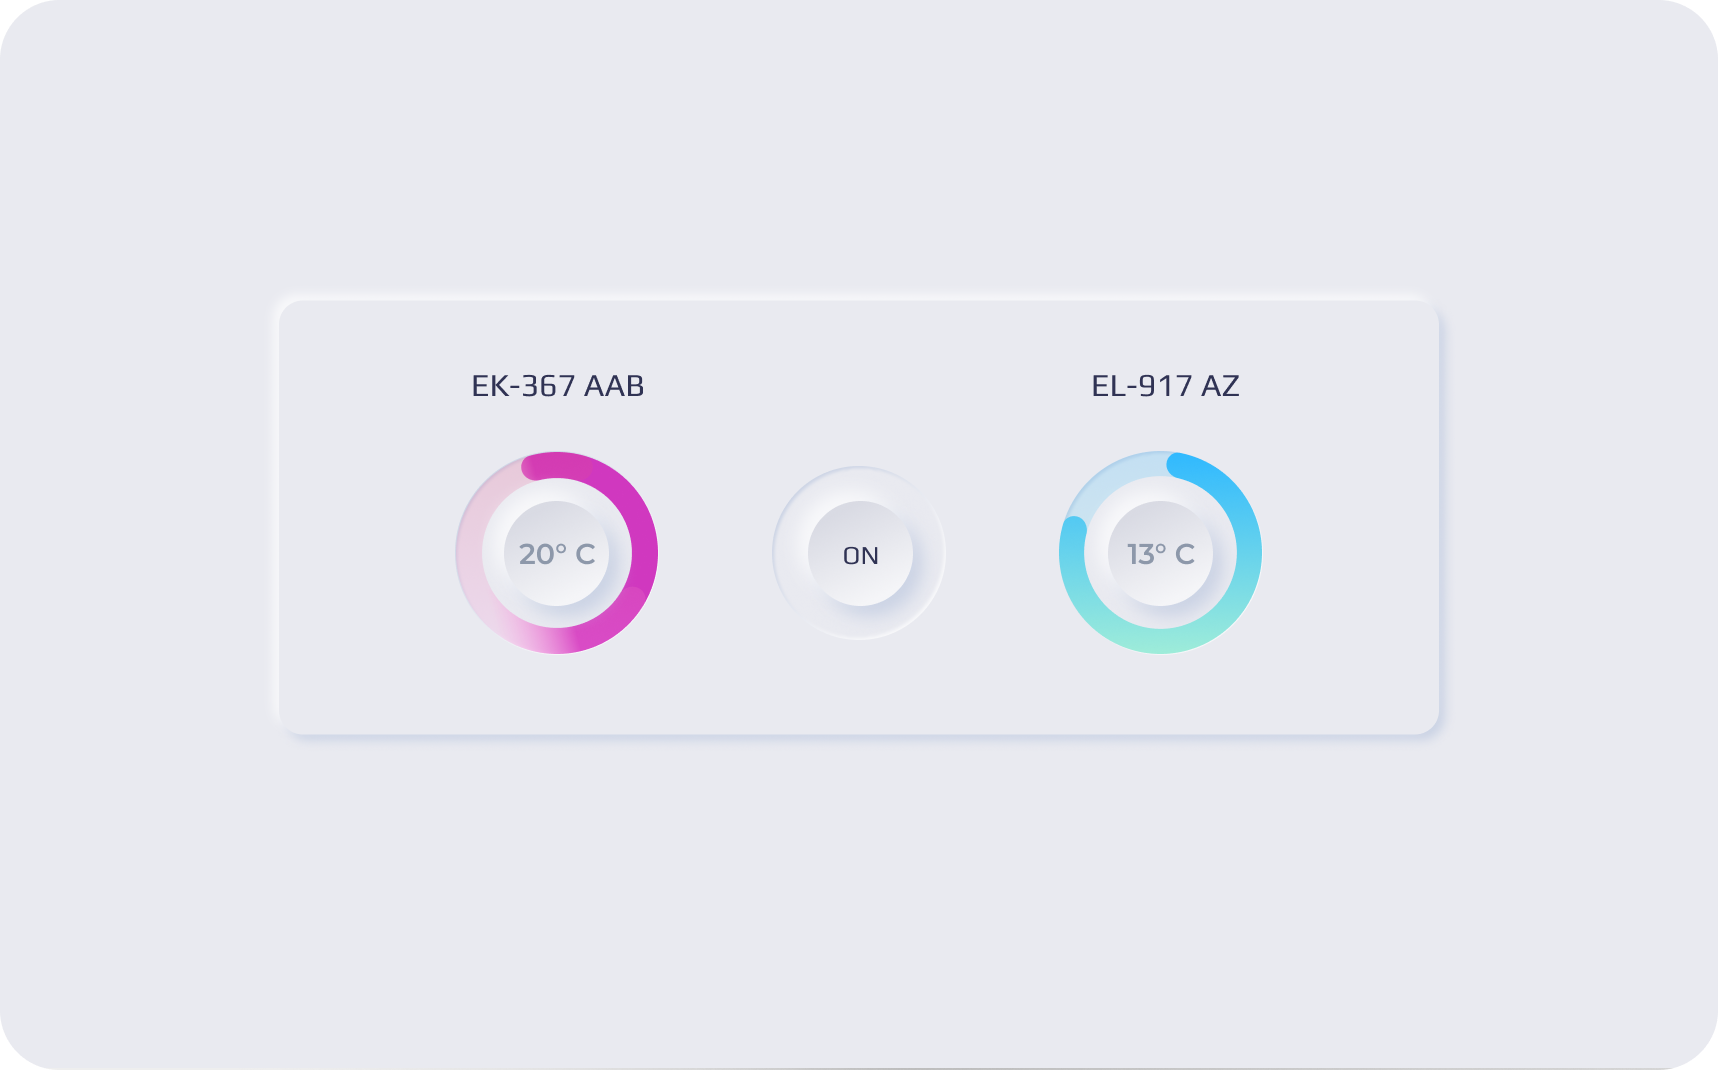
Another crucial element was a color with exceptionally high contrast to highlight key data points and warmer temperatures, and it needed to complement the dark blue. After careful consideration, a vibrant hot pink was selected for this role, as its high-contrast and eye-catching nature drew immediate attention.
The chosen typography 'Play', features a subtle futuristic styling that aligns well with the technological aspect. Moreover, it offers excellent legibility, making it an exceptionally user-friendly typeface.
The icons were custom-designed, following industry standards for easy interpretation. By incorporating a touch of roundness and softness, they seamlessly integrated with the overall design. All icons were vectorized as SVGs to ensure no pixelation would occur.
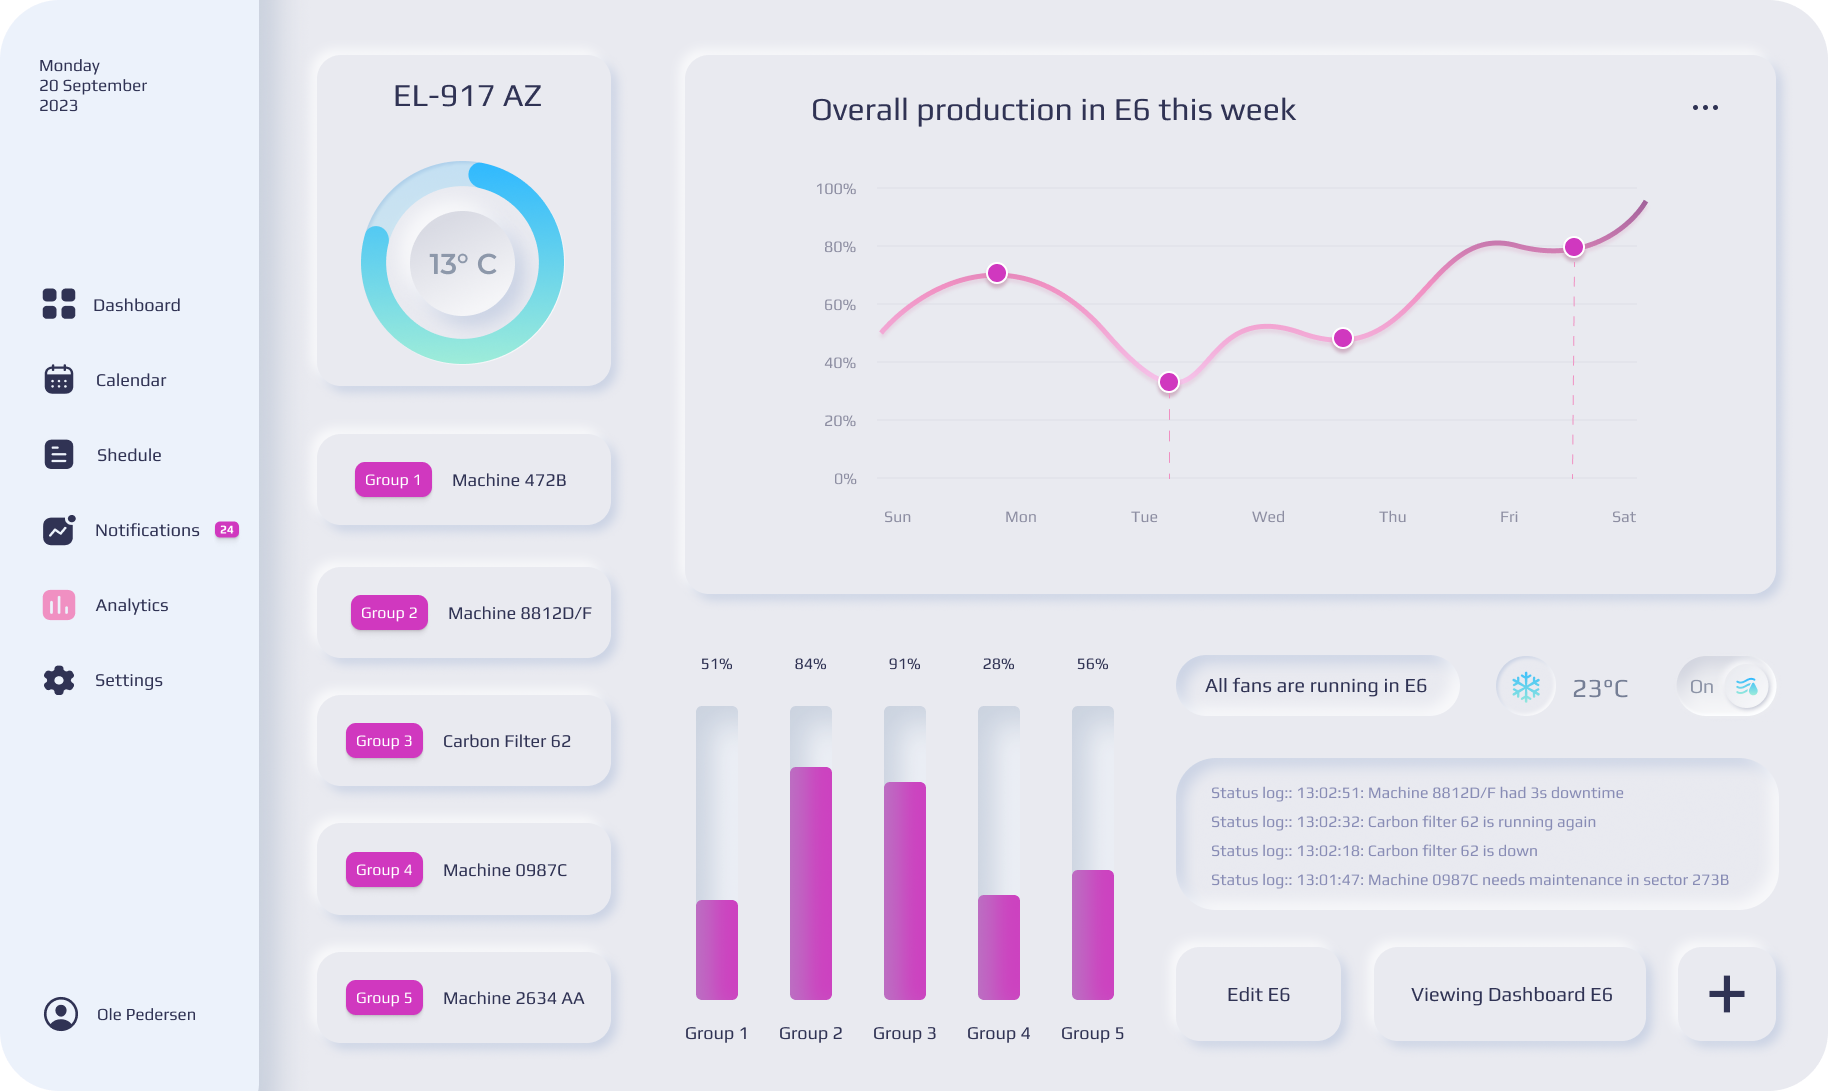
The final design
In consideration of the sensitive nature of the data, I've replaced all the information in the dashboard examples to ensure data security and confidentiality.
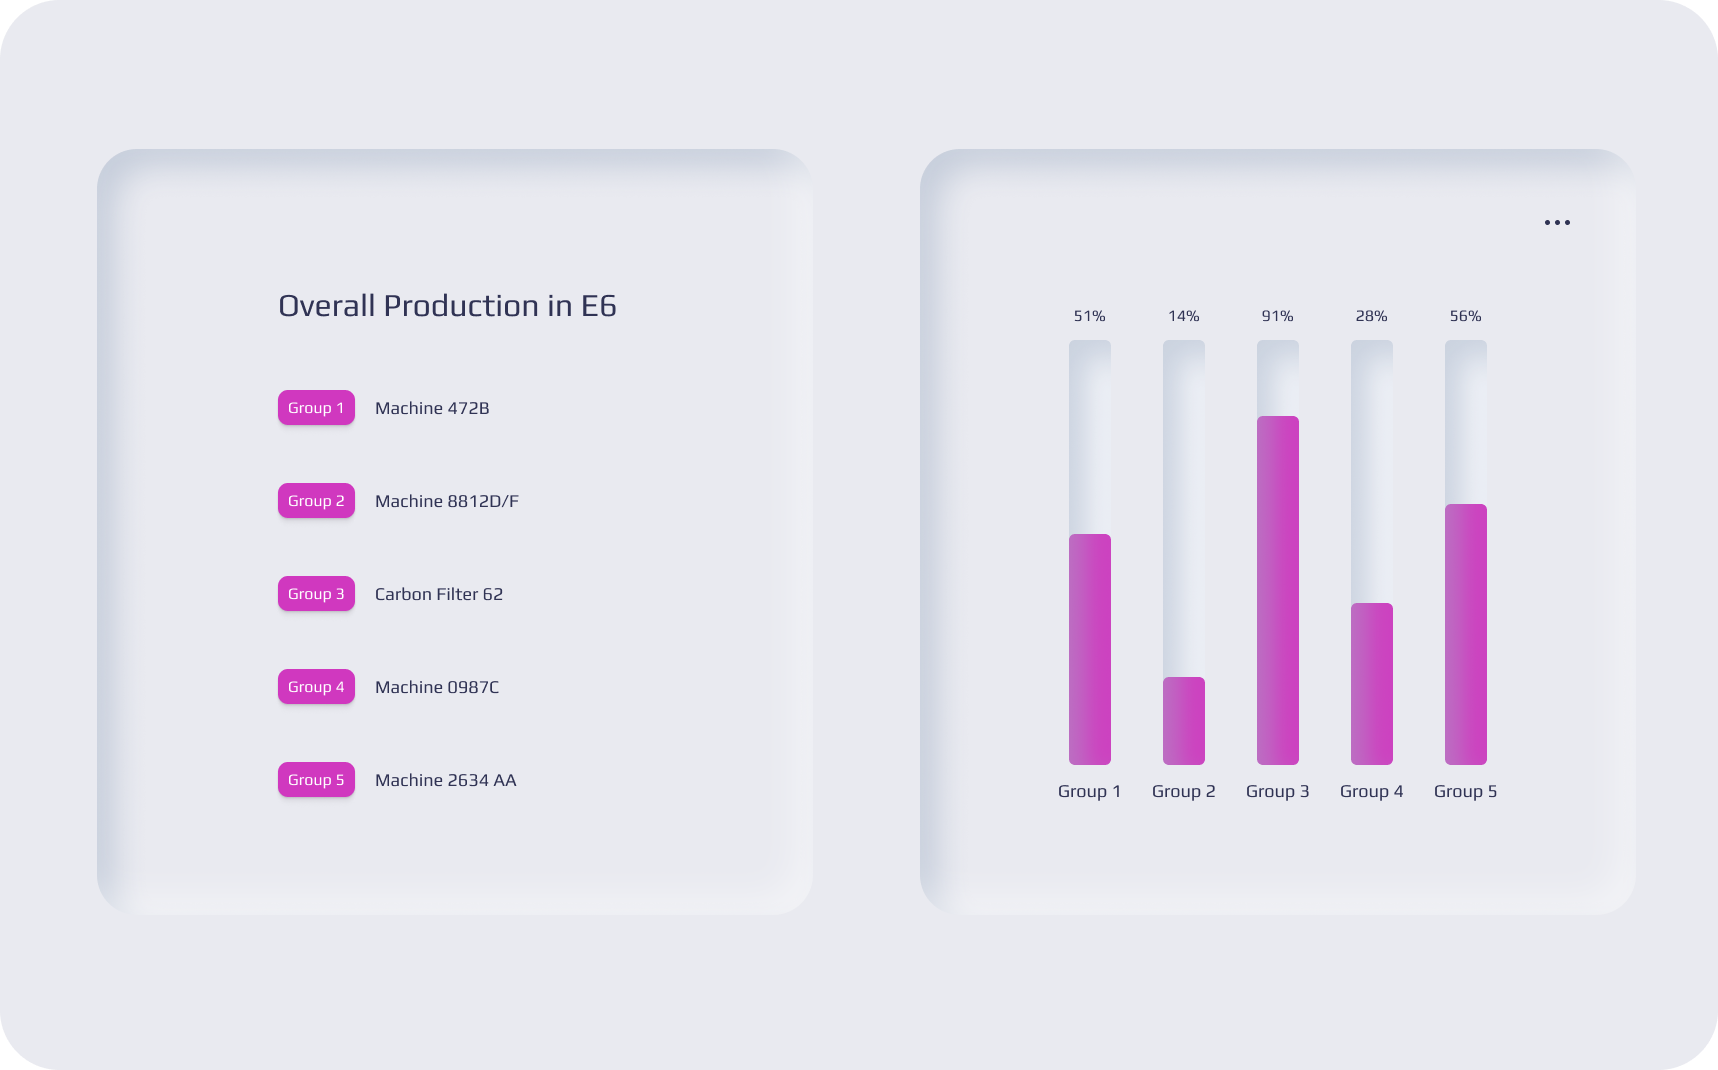
This dashboard solution offered full customizability through a straightforward drag-and-drop approach, ensuring that the process of building and personalizing the dashboard was effortless for anyone.
A customizable dashboard empowers users to personalize their interface, arranging information and features in a way that suits their workflow. This flexibility makes the dashboard a more effective tool for individual users.
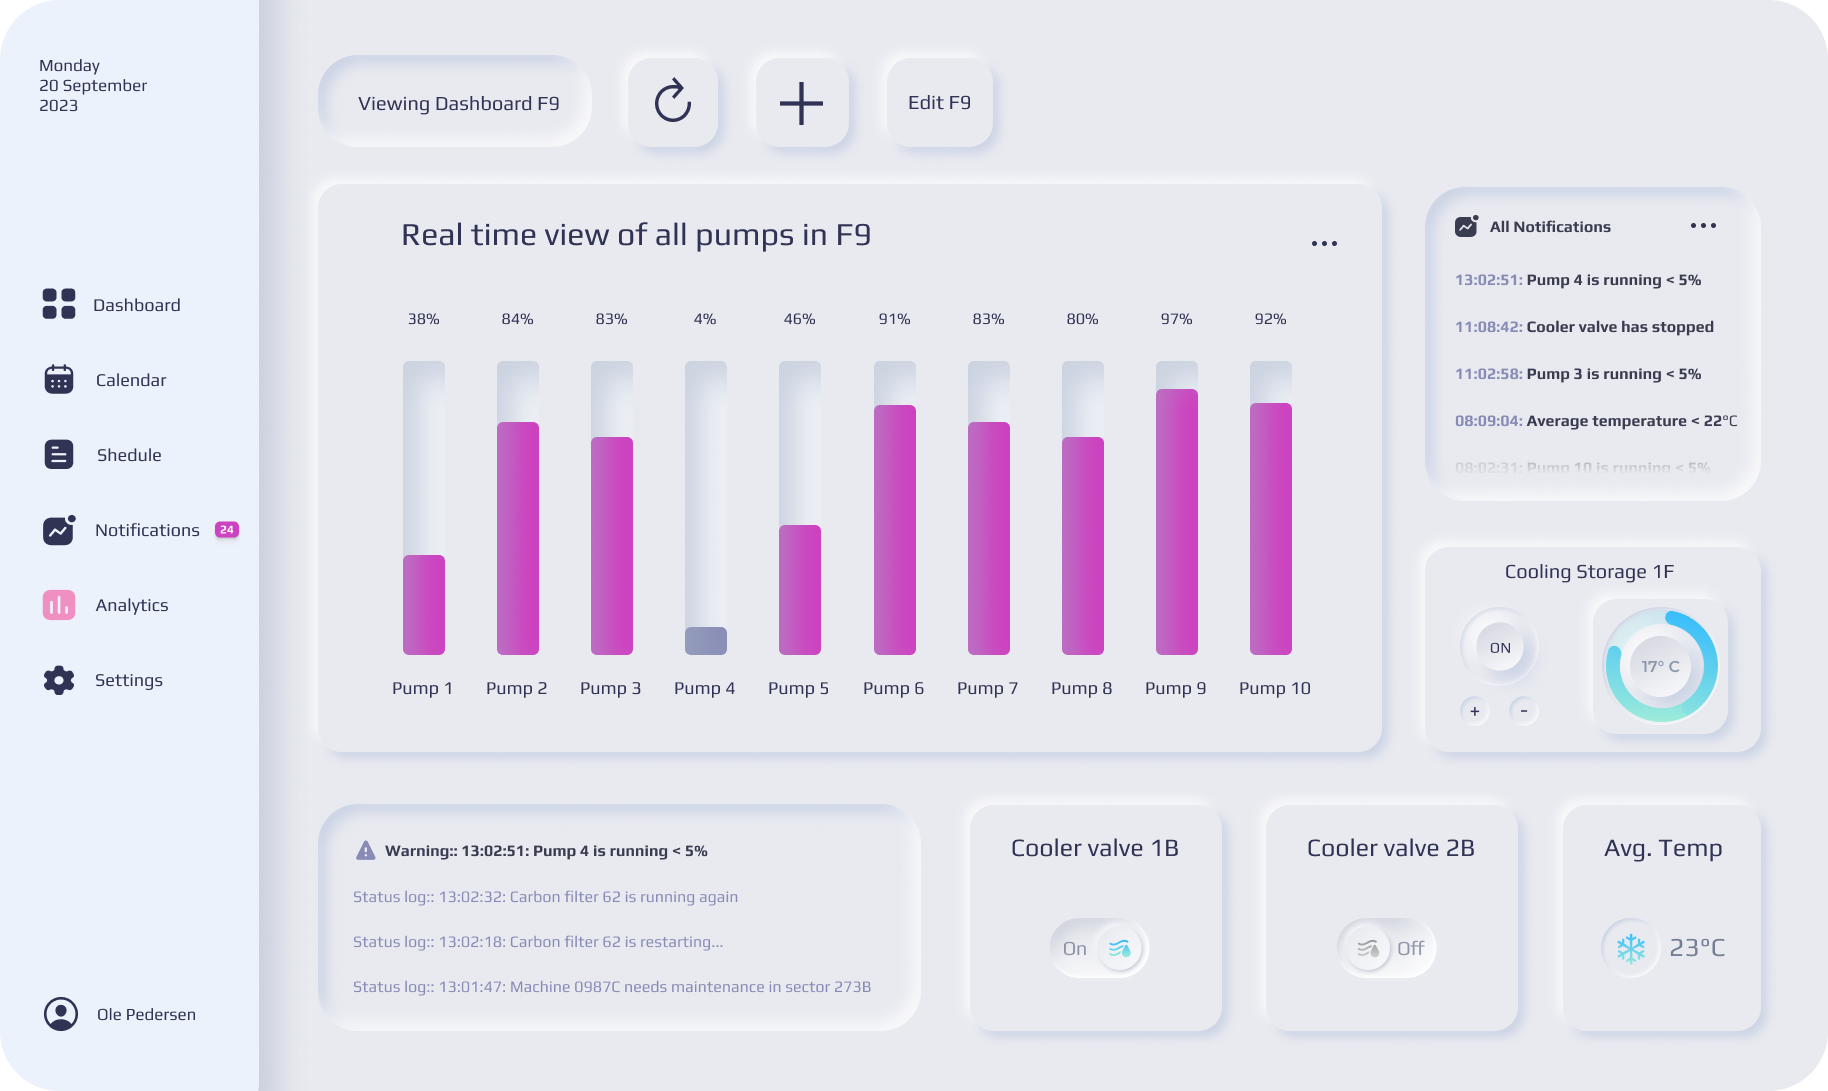
Once a template was selected, it became equally easy to modify the dashboard, allowing users to effortlessly make changes or add new elements to suit their needs.
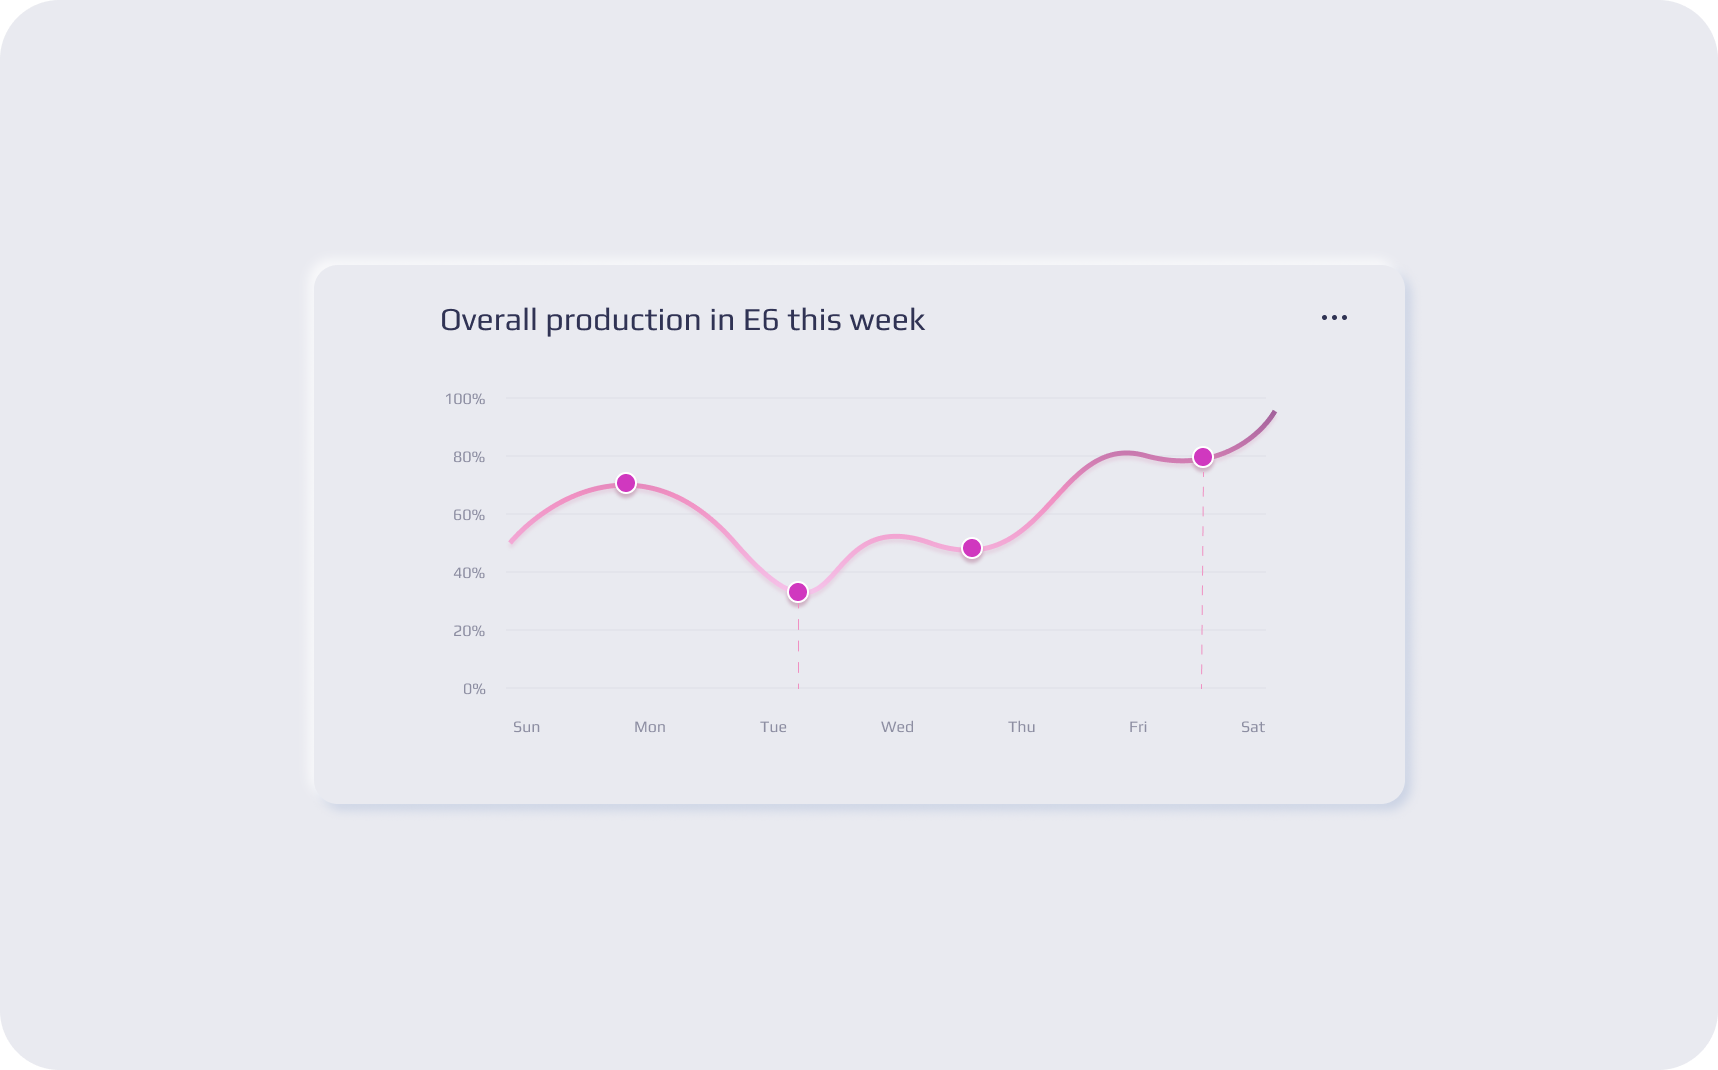
By accessing the kebab menu, users could seamlessly switch between design formats, transitioning from a pillar diagram to a line diagram with ease.
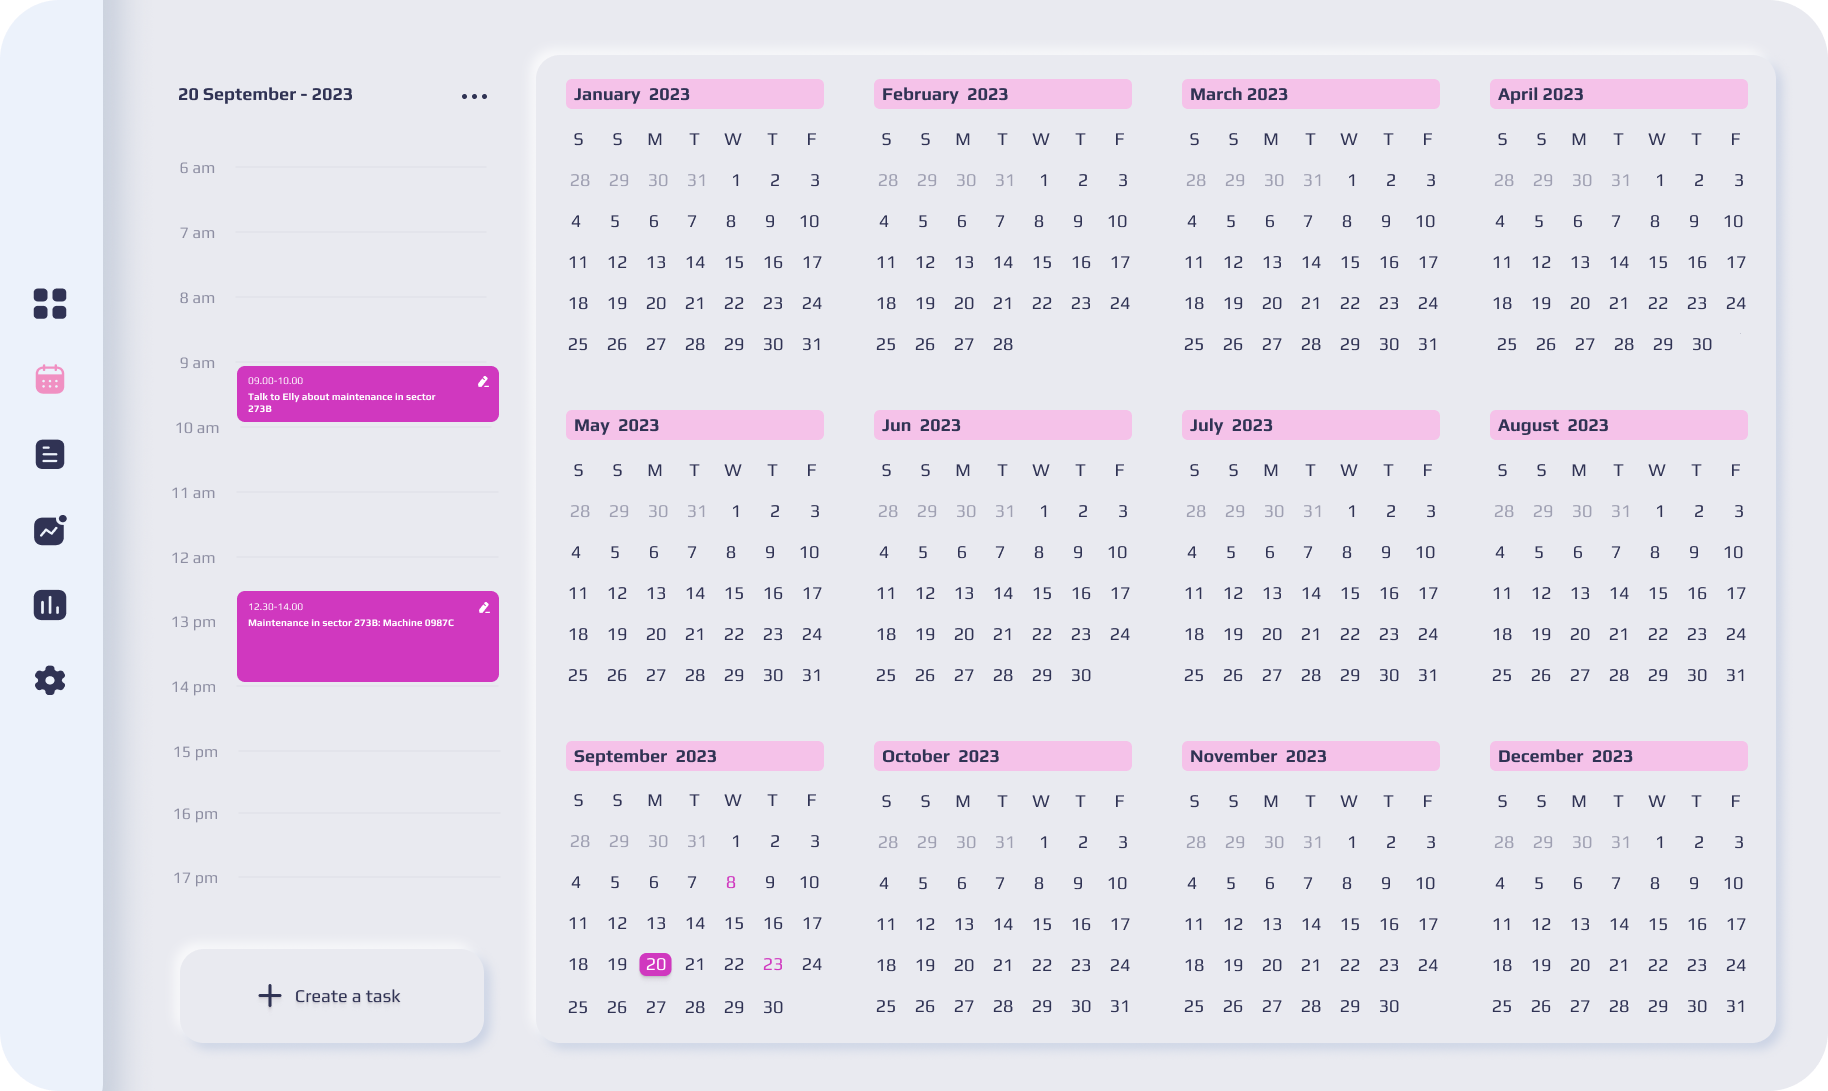
The calendar function within the dashboard is a valuable feature that offers users a centralized hub for managing their appointments and offers a clear overview of the day.
Presenting the new design to the interviewees was an enjoyable experience because their enthusiasm was truly infectious. This is one of the most rewarding aspects of being a product designer – the genuine delight it brings to the users.
It is important to highlight that the design showcased is a mockup and, regrettably, it never progressed into development. Despite receiving positive feedback, the decision was made to retain their existing dashboard design.